14-Using ROS 2 RViz2
1. Introduction to RViz2
During robot development, many functions require data-level analysis, which can be difficult to interpret directly from raw values. For example, when working with robot models, developers often need to understand both the visual appearance and the internal coordinate frame relationships during motion.
For robotic arm motion planning and mobile robot autonomous navigation, it is essential to visualize:
- The robot's surrounding environment\
- The planned navigation path\
- Sensor information such as cameras, 3D cameras, and LiDAR
Data is used for calculations, while visualization is used for human interpretation.
RViz2 is a powerful data visualization tool designed specifically for ROS 2 robot development. It supports visualization of:
- Robot models\
- Sensor data\
- Environmental information
2. Preparation
- If you have a physical robot, you can launch RViz2 directly on the robot controller.
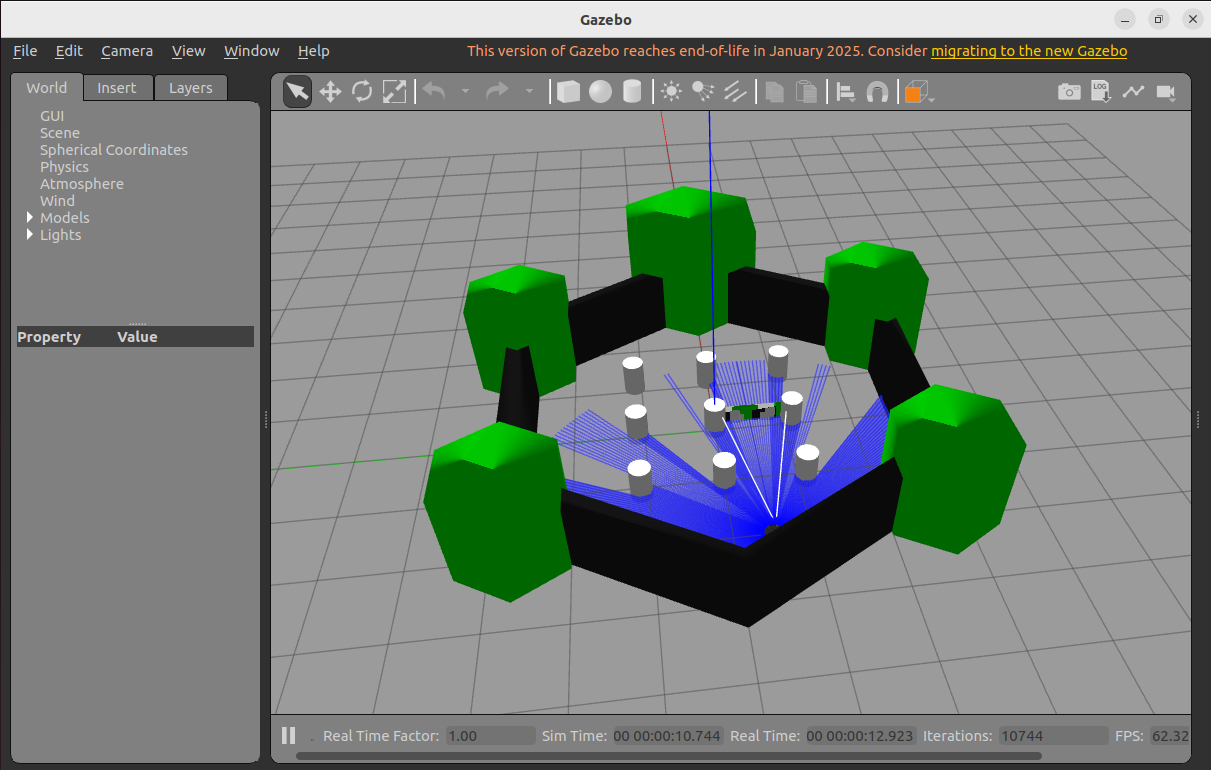
- If you do not have a physical robot, you can use Gazebo to simulate a TurtleBot3 robot, including LiDAR, camera, and other sensors.
The following installation steps are optional. If you already have a physical robot configured with multi-machine communication, you can directly use the real robot's sensor data. This section is intended for users without a physical robot.
This lesson uses a simulated robot to demonstrate the visualization capabilities of RViz2. The workflow is identical for both real and simulated robots.
Install the TurtleBot3 Simulation Package
sudo apt install ros-${ROS_DISTRO}-turtlebot3*
Install the ROS--Gazebo Bridge
sudo apt install ros-${ROS_DISTRO}-ros-gz
Set the TurtleBot3 Robot Type
export TURTLEBOT3_MODEL=waffle
Start the Gazebo Simulation Environment
ros2 launch turtlebot3_gazebo turtlebot3_world.launch.py
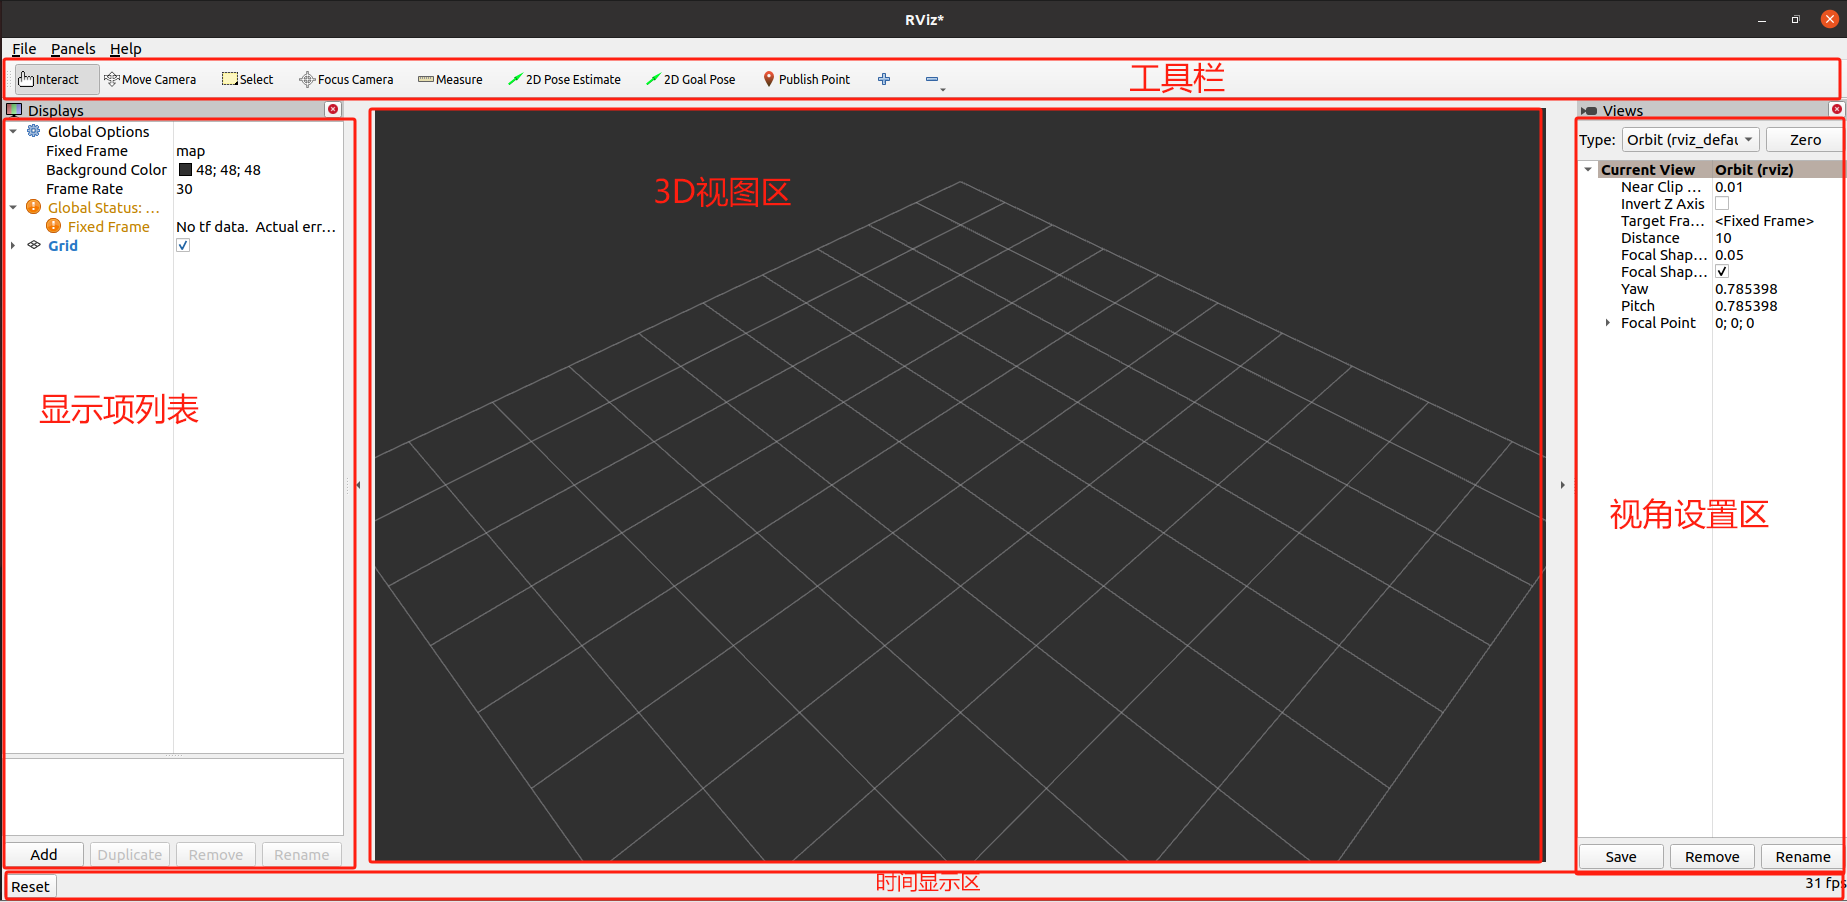
3. Starting RViz2
Open a terminal and start RViz2 using:
rviz2
If you are starting RViz2 inside Docker, make sure GUI support is properly enabled.
4. Image Data Visualization
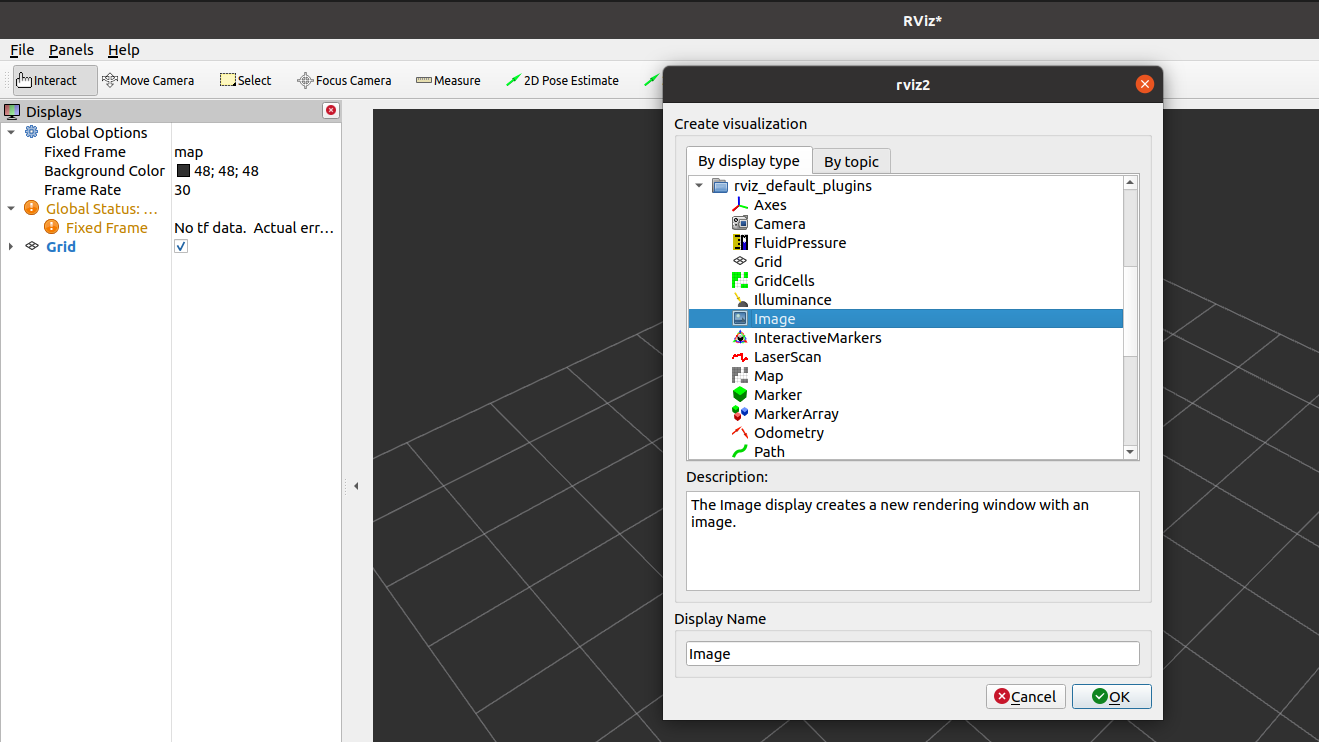
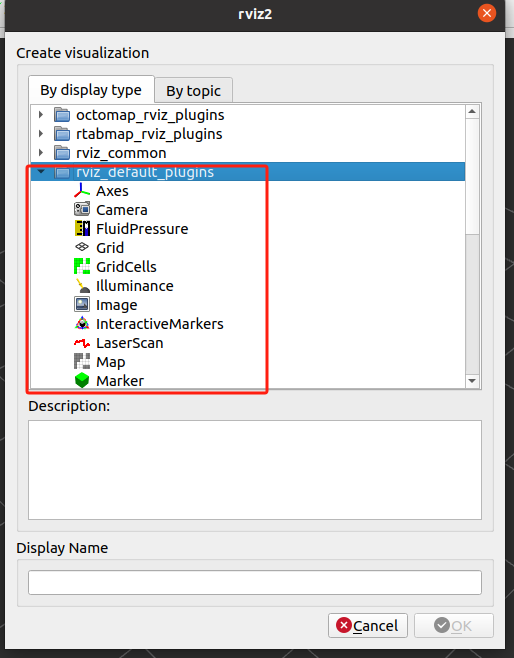
- Click Add in the Displays panel on the left.
- Select Image and confirm.
- Configure the topic that the display subscribes to.
Configuration Tips
-
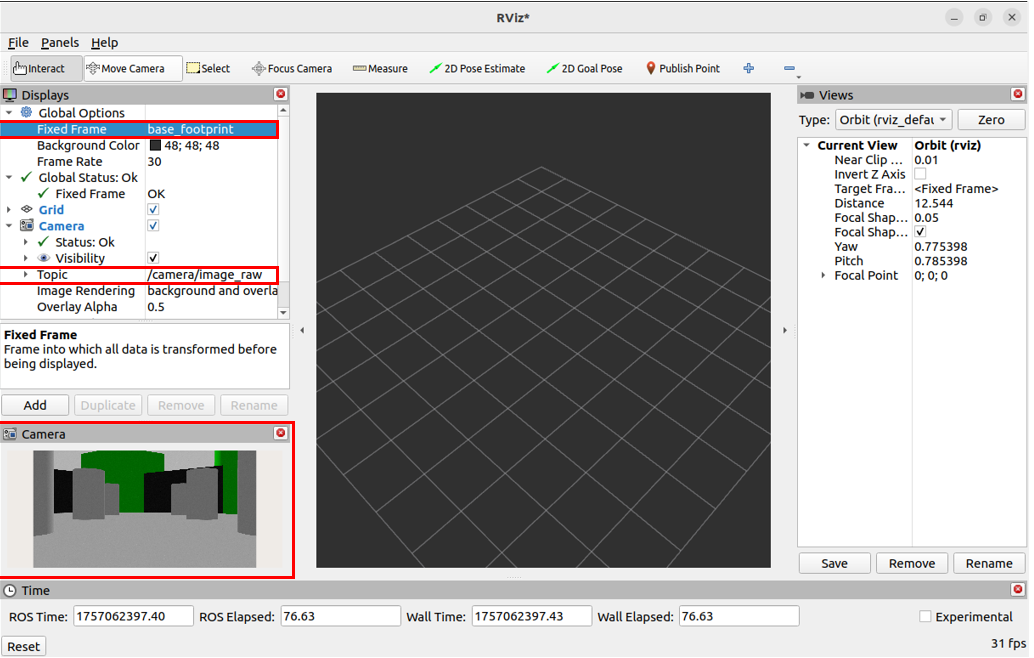
Set Fixed Frame to:
base_footprint -
Select the camera image topic:
/camera/image_raw
You can now view the robot's real-time camera feed.
5. Radar (LiDAR) Data Visualization
- Click Add in the Displays panel.
- Select LaserScan.
- Configure the topic name.
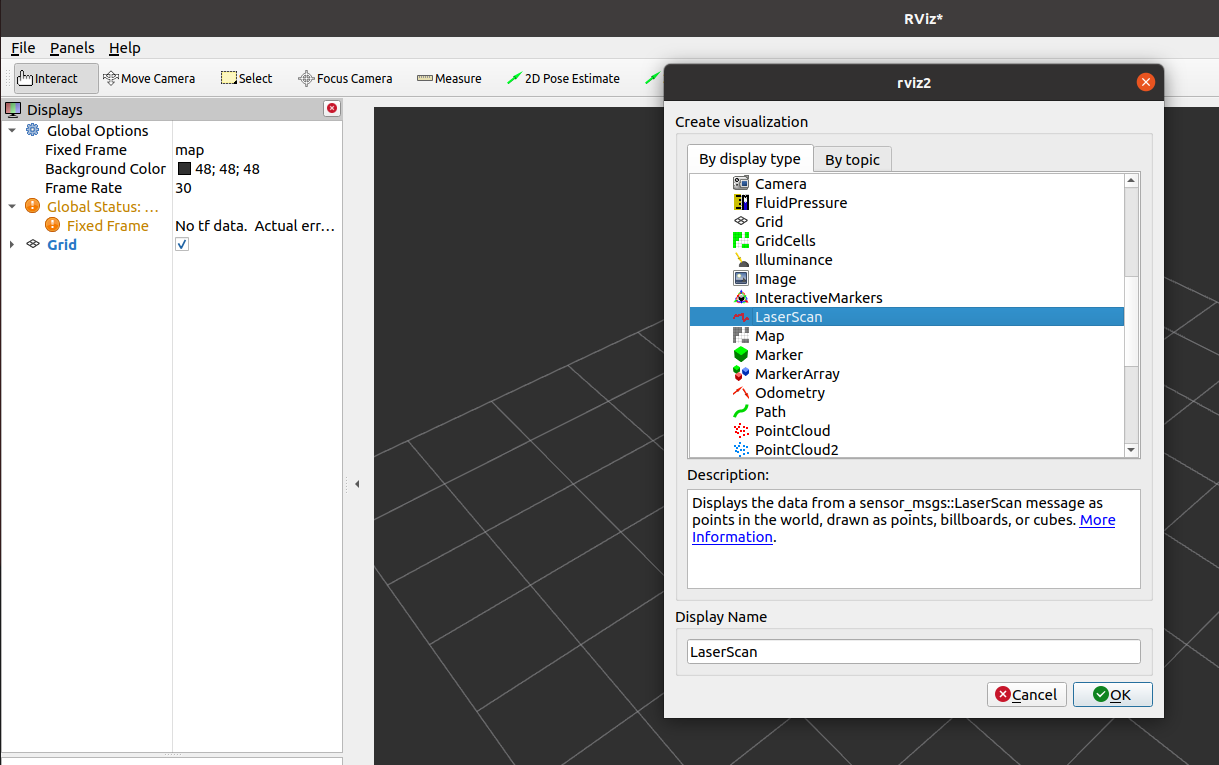
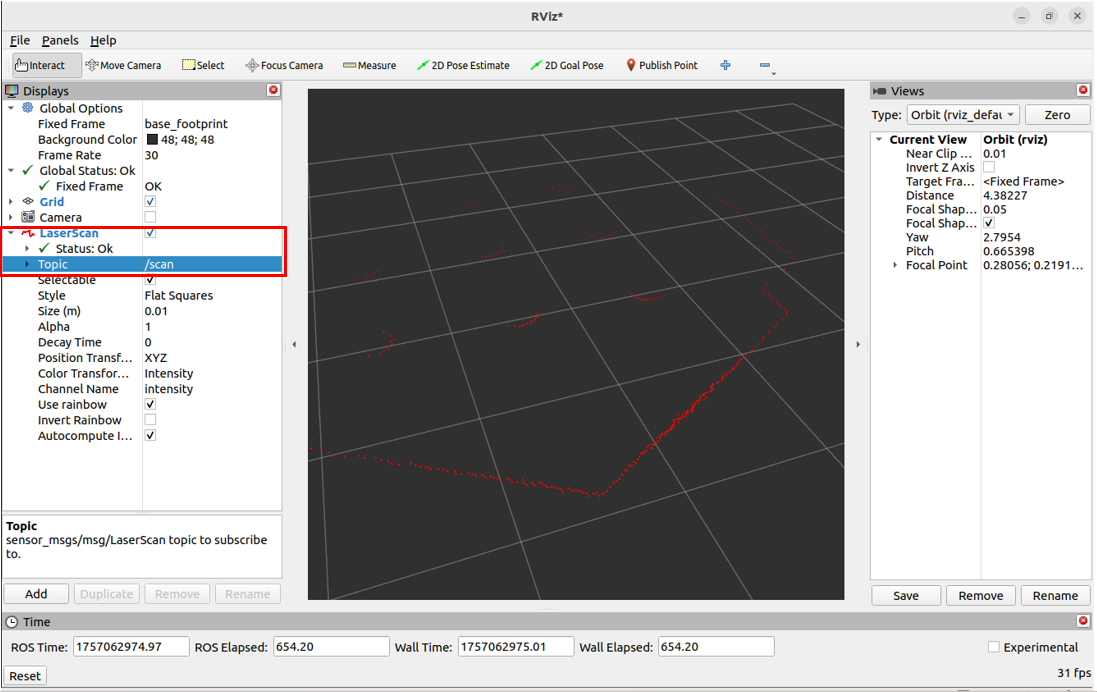
Configuration
-
Select the LaserScan topic:
/scan
You will now see the LiDAR point cloud outline.
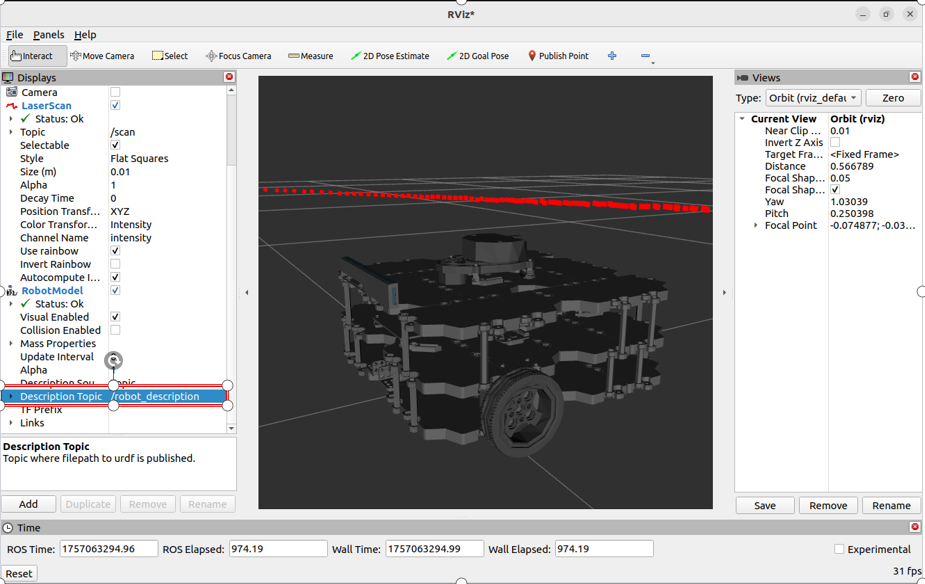
6. Robot Model Visualization
- Click Add in the Displays panel.
- Select RobotModel.
Configuration
-
Set Description Topic to:
/robot_description
You can now see the full robot model visualized in RViz2.
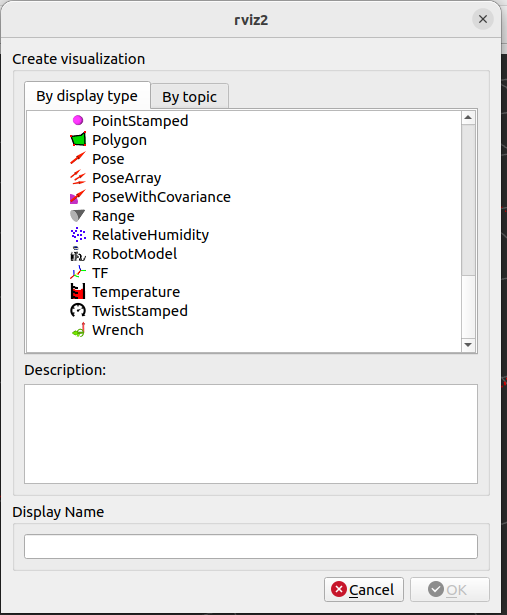
7. Other Data Visualizations
The rviz_default_plugins section includes many commonly used
visualization plugins such as:
- TF
- Path
- PointCloud2
- Marker
- Grid
Feel free to experiment with these tools to better understand your robot's perception and planning systems.
This documentation is maintained by HemiHex for ROS 2 visualization and development workflows.